Visualizing ML training using TensorFlow.js and Baseball data
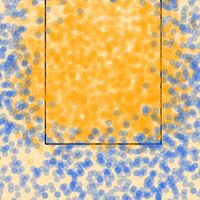
The heatmap below illustrates a deep-neural network learning to call a strike zone. Blue dots represent balls and orange dots represent strikes from the training data. The blue areas of the heat map represents areas the model classifies as a ball. Orange areas are classified as a strike. If you’re …
 observablehq.com