OECD Threatened species data analysis 4 - making bar plot with error bars in R
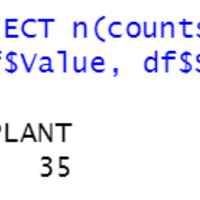
This blog is following of www.crosshyou.info In this blofg, I will make barplot with error bars. 1. check n(number of overbations) of each SUBJECT We see BIRD has 36, MAMAL has 34 and PLANT has 35 observations. 2. calculate average pf each SUBJECT We see BIRD has the highest average. Plant has the …


